📈 Bitcoin Analysis: Why Everyone’s Watching the $80K Level
🚀 Executive Summary
What you’ll learn in 3 minutes:
- Bitcoin just broke out of a downtrend and rallied straight into major resistance near $80,425.
- Price is now stuck between $76,560 support and $80,425 resistance — this range decides what comes next.
- This bitcoin analysis shows you, in plain English, what a breakout or breakdown would mean for your next move.
Understanding Bitcoin Analysis: The 3-Second Breakdown
Bitcoin analysis is basically reading the market’s mood through price charts — and right now, the mood is genuinely interesting. After months of sliding lower, Bitcoin found its footing, broke out of a downtrend, and shot straight up into a ceiling near $80,425. That’s a level that matches the highs from May, which makes it a big deal.
Think of it like a ball bouncing up a staircase. The ball dropped, hit a step it trusted (support around the rising line from the December 2022 lows), and bounced hard. Now it’s pressed against the ceiling of the current floor. I’ve been watching charts for years, and moments like this — right before price either breaks through or gets rejected — are when technical analysis actually earns its keep.

Why does this matter in 2026? Because Bitcoin tends to lead the entire crypto market. When BTC makes a decisive move, altcoins usually follow within days. So even if you only hold a small slice of crypto, this single chart setup is worth understanding.
How Bitcoin Analysis Works: The Technical Details
Let me translate the chart-speak into everyday language. Three things are happening at once, and each one tells part of the story.
Support and Resistance: The Floor and the Ceiling
Support is a price where buyers historically step in — like a floor. Resistance is where sellers show up — like a ceiling. Bitcoin is currently squeezed between $76,560 (support) and $80,425 (resistance). It’s been bouncing inside that band, and that’s completely normal after a sharp rally. Markets need to catch their breath, just like runners do.
What I’ve noticed over the years is that the longer price consolidates in a tight range, the more explosive the eventual breakout tends to be. This range has been building for a while, so the next move could be significant.
The Channel Breakout: Escaping the Slide
Before this rally, Bitcoin was sliding down a descending channel — a repeating pattern of lower highs and lower lows that started from the October 2025 peak. Breaking above the top of that channel was the moment the correction officially ended, at least on paper. That breakout is what launched price directly into the $80,425 ceiling.
The Moving Average Story: A Golden Cross Brewing
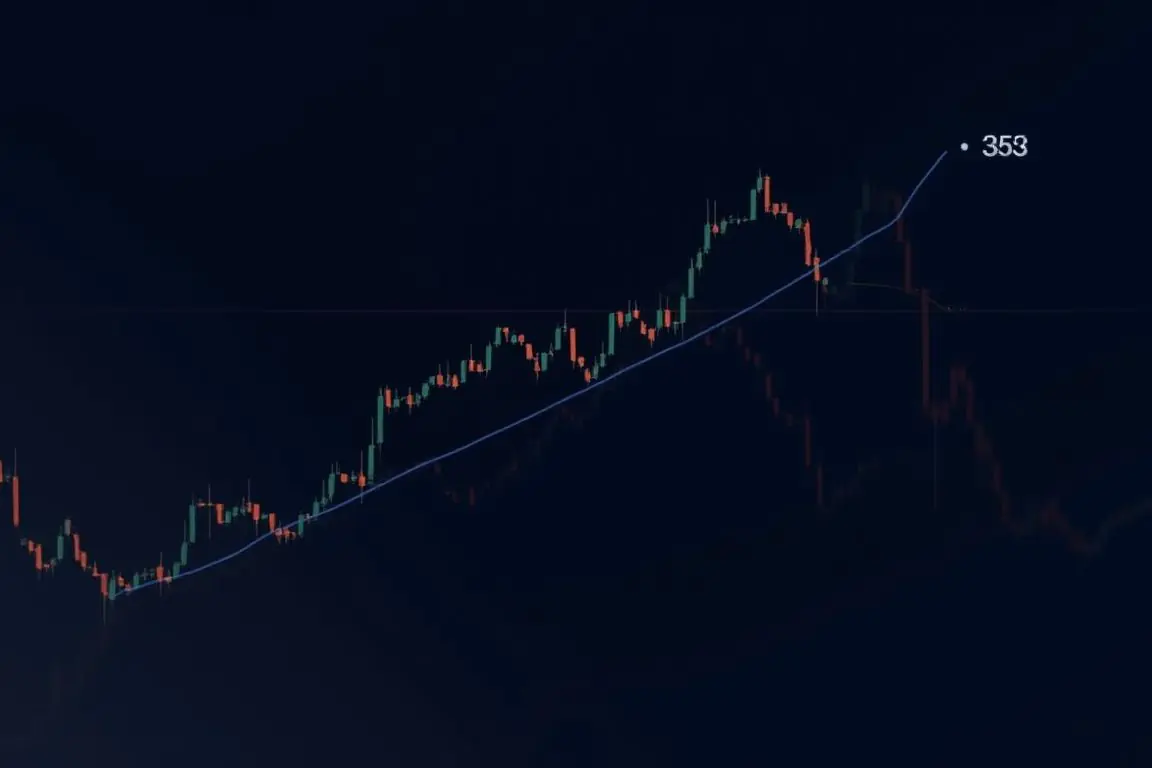
Here’s the medium-term signal that has chart watchers excited. The 50-day moving average (the average price over the last 50 days) is climbing toward the 200-day moving average. When the shorter one crosses above the longer one, traders call it a “golden cross” — historically a sign of strengthening momentum.
But I’ll be honest with you: indicators alone don’t confirm anything. Price action does. A golden cross setup that fails means nothing if buyers can’t push above $80,425. Treat indicators as clues, not verdicts.
| Feature | Bullish Case | Bearish Case |
|---|---|---|
| Key level | Closes above $80,425 | Rejection below $76,560 |
| Trend signal | 50 MA rising toward 200 MA | Failed breakout re-enters range |
| Structure | Higher low from December 2022 trendline holds | Deeper pullback toward lower channel support |
| What it means | Broad uptrend resumes | More consolidation before the next leg |
Some consolidation or a pullback after a sharp rally is normal. The key for buyers is holding above $76,560 and ultimately getting acceptance above $80,425 — that’s what confirms a breakout past the May highs.
The Real Impact of Bitcoin Analysis on Your Decisions
Benefits (The “Why It Matters”)
Good bitcoin analysis gives you a plan instead of a panic. Instead of guessing whether to buy or sell, you have two clear reference points: $76,560 and $80,425. A sustained move above resistance favors buyers; a drop below support suggests waiting for a deeper pullback.
It also keeps you from chasing. After a sharp rally, the temptation to FOMO in at the top is real. Knowing that consolidation is normal — even healthy — stops you from making emotional decisions.
Challenges (The “What To Watch Out For”)
Charts don’t work in a vacuum. A surprise macro headline, an interest rate decision, or a large liquidation event can slice through support like it isn’t there. I’ve watched picture-perfect setups get wrecked by a single news cycle more times than I can count.
Another trap: fakeouts. Price sometimes pokes above resistance, sucks in buyers, then collapses back into the range. That’s why the original analysis emphasizes “acceptance” above $80,425 — meaning multiple daily closes above it, not a one-candle spike.
And sizing matters. Even with a clean setup, position sizing and stop losses are what keep you in the game. For more on managing risk, check out Cryptocurrency.
The Future of Bitcoin Analysis: Predictions for 2026
So what happens next? If buyers push and hold above $80,425, the structure opens up toward the next major resistance zones and the broader advance could resume. If sellers win and $76,560 breaks, expect a deeper pullback — which, honestly, wouldn’t be the end of the world. Corrective dips within a larger uptrend are how markets build energy.
The moving average picture adds to the cautious optimism. A confirmed golden cross on the daily chart has historically preceded strong multi-month trends, though past performance never guarantees future results.
My take: the technical structure is improving, but the verdict isn’t in until the range resolves. Patience here isn’t weakness — it’s the whole game.
How to Leverage Bitcoin Analysis for Massive Success
Here’s a simple framework I use whenever Bitcoin is stuck in a range like this:
- Mark the levels. Write down $76,560 and $80,425. These are your decision points, not gut feelings.
- Wait for confirmation. Look for daily candle closes outside the range, not intraday spikes. Fakeouts love intraday traders.
- Watch volume. A real breakout comes with strong volume. A weak-volume push above resistance is a red flag.
- Check the moving averages. Track whether the 50 MA confirms its climb toward the 200 MA — a completed golden cross strengthens the bull case.
- Plan both scenarios. Decide in advance what you’ll do on a breakout and on a breakdown. Deciding before the move removes emotion from the trade.
- Size sensibly. Never risk more than you can comfortably lose, especially right before a major range resolution.
Want to go deeper on chart basics? Our guide at Investing covers support, resistance, and trendlines from scratch.
Frequently Asked Questions About Bitcoin Analysis
What is bitcoin analysis in simple terms?
It’s the practice of studying Bitcoin’s price charts to guess where the price might go next. You look at patterns like support (where buying pressure appears) and resistance (where selling pressure appears) to make smarter decisions instead of guessing.
Why is the $80,425 level so important right now?
Because it lines up with the May highs. Breaking and holding above a previous major high signals that buyers are in control and the broader uptrend is resuming.
What happens if Bitcoin falls below $76,560?
Losing that support would suggest the rally ran out of steam, and a deeper pullback becomes likely before the next attempt to move higher. It’s not necessarily bearish long-term — just a longer wait.
What is a golden cross?
It’s when the 50-day moving average crosses above the 200-day moving average. Traders see it as a sign of building upward momentum, though it should always be confirmed by actual price movement.
Can bitcoin analysis predict the future?
No — and anyone who claims it can is selling something. Good analysis gives you probabilities and clear levels to react to, not certainties.
Is a pullback after a rally a bad sign?
Not at all. Consolidation and modest pullbacks are completely normal after sharp moves. They let the market reset before the next leg, whether that leg is up or down.
How do I avoid fake breakouts?
Wait for confirmation: multiple daily closes beyond the level, strong volume, and ideally a successful retest of the broken level as support or resistance.
Final Thoughts
Here’s where I land after staring at this chart for too long: the structure is genuinely improving, the breakout was real, and the range between $76,560 and $80,425 is the courtroom where the next verdict gets delivered. Don’t predict it — prepare for both outcomes, and let price do the talking. If you found this bitcoin analysis useful, bookmark the two key levels and check back after the next few daily closes. That’s when the story gets good.
ชอบบทความนี้? ค้นพบสินค้าที่เกี่ยวข้องบน Shopee